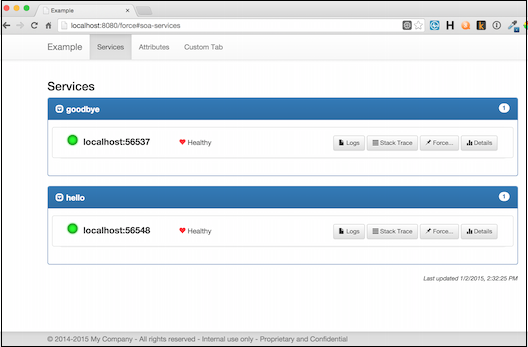
Administration Console
The Soabase administration console is a customizable view of your entire SOA cluster. With it you can...
- See the status of each instance
- Force register/unregister any instance
- View log files for any instance
- View stack traces for any instance
- Monitor VM details or any Dropwizard metric
- Create, read, update, delete Dynamic Attributes
- Add your own custom UIs
- Add your own custom metric views
Usage/Building
The Administration Console is a standard Dropwizard application that, itself, uses Soabase. To create a console for your SOA system, start a new Dropwizard project and include a dependency for the Soabase admin console:
io.soabase:soabase-admin
Use the AdminConsoleAppBuilder to create the application instance. The main builder methods are:
| withConfigurationClass() | required - this is class of your Configuration file. The Soabase admin console needs the same configuration that you use for your Soabase services so that it can access Discovery, Attribute, etc. config fields. |
| addingBundle() | add any additional bundles. E.g. SqlBundle and CuratorBundle |
| addingTabComponent() | adds a custom tab |
| addingMetricComponent() | adds a custom metric |
Call build() to build a new admin console application instance. Then, use Dropwizard methods to run the application.
Running
Build your admin console as described in the Dropwizard docs. When you run the application, you will be able to see the console from a browser. Assuming port 8080, go to http://localhost:8080.

For details on using the console, see the Admin Console Example page.
Customizing
Adding a custom metric
You can add a custom graph for any Dropwizard metric to the admin console's details page by calling addingMetricComponent() in the app console builder passing a MetricComponent with a description of the metric:
| Field | Description |
| MetricComponent | |
| id | A unique ID for your metric |
| type | The metric type (see below) |
| name | The display name of your metric |
| label | The label for the Y axis of the graph |
| metrics | List of metrics to display in the graph (see below) |
| MetricType | |
| STANDARD | Plots the metric values unchanged |
| PERCENT | Converts the metric values to percents from double values between 0 and 1 |
| DELTA | Plots each metric value as a delta from the previous metric value |
| Metric | |
| label | The label for the X axis of the graph |
| path | The Dropwizard metric to display. The syntax is that of a Javascript array reference. The Soabase admin console calls eval('data.' + path) to get the value to plot. 'data' is the JSON object generated by the Dropwizard metrics servlet. E.g. gauges['system.cpu.load'].value |
Adding a custom tab
To add a custom tab create an HTML file for your tab and, optionally, css and javascript files and any other assets. Then, call addingTabComponent() in the app console builder passing a TabComponent:
| Field | Description |
| TabComponent | |
| id | A unique ID for your tab |
| name | The display name of your tab |
| contentResourcePath | The source path for your tab's HTML file |
| javascriptUris | Relative URIs for any javascript files to reference |
| cssUris | Relative URIs for any css files to reference |
| assetsPaths | List of AssetsPaths (see below) |
| AssetsPath | |
| resourcePath | The source path |
| uriPath | The uri of the assets |
Custom tabs are bound into the admin console source. Your tab's HTML file will be merged into the admin console's HTML file. So, be aware that you are in a shared environment. Use unique IDs, class names etc.
Frameworks
The admin console uses Twitter Bootstrap. Your tab can take advantage of this. The following frameworks are automatically included:
Templates
The admin console includes a very simple template system. In your HTML file, you can define templates that can be used to generate content. The form for templates is:
<div class="soa-template" id="unique-template-id">
    Your content goes here. Add any VARIABLE that can be substituted
    later on.
</div>
Then, in your javascript file, you can get the content of your template:
var template = soaGetTemplate('unique-template-id', {
    'VARIABLE': substitution
});
